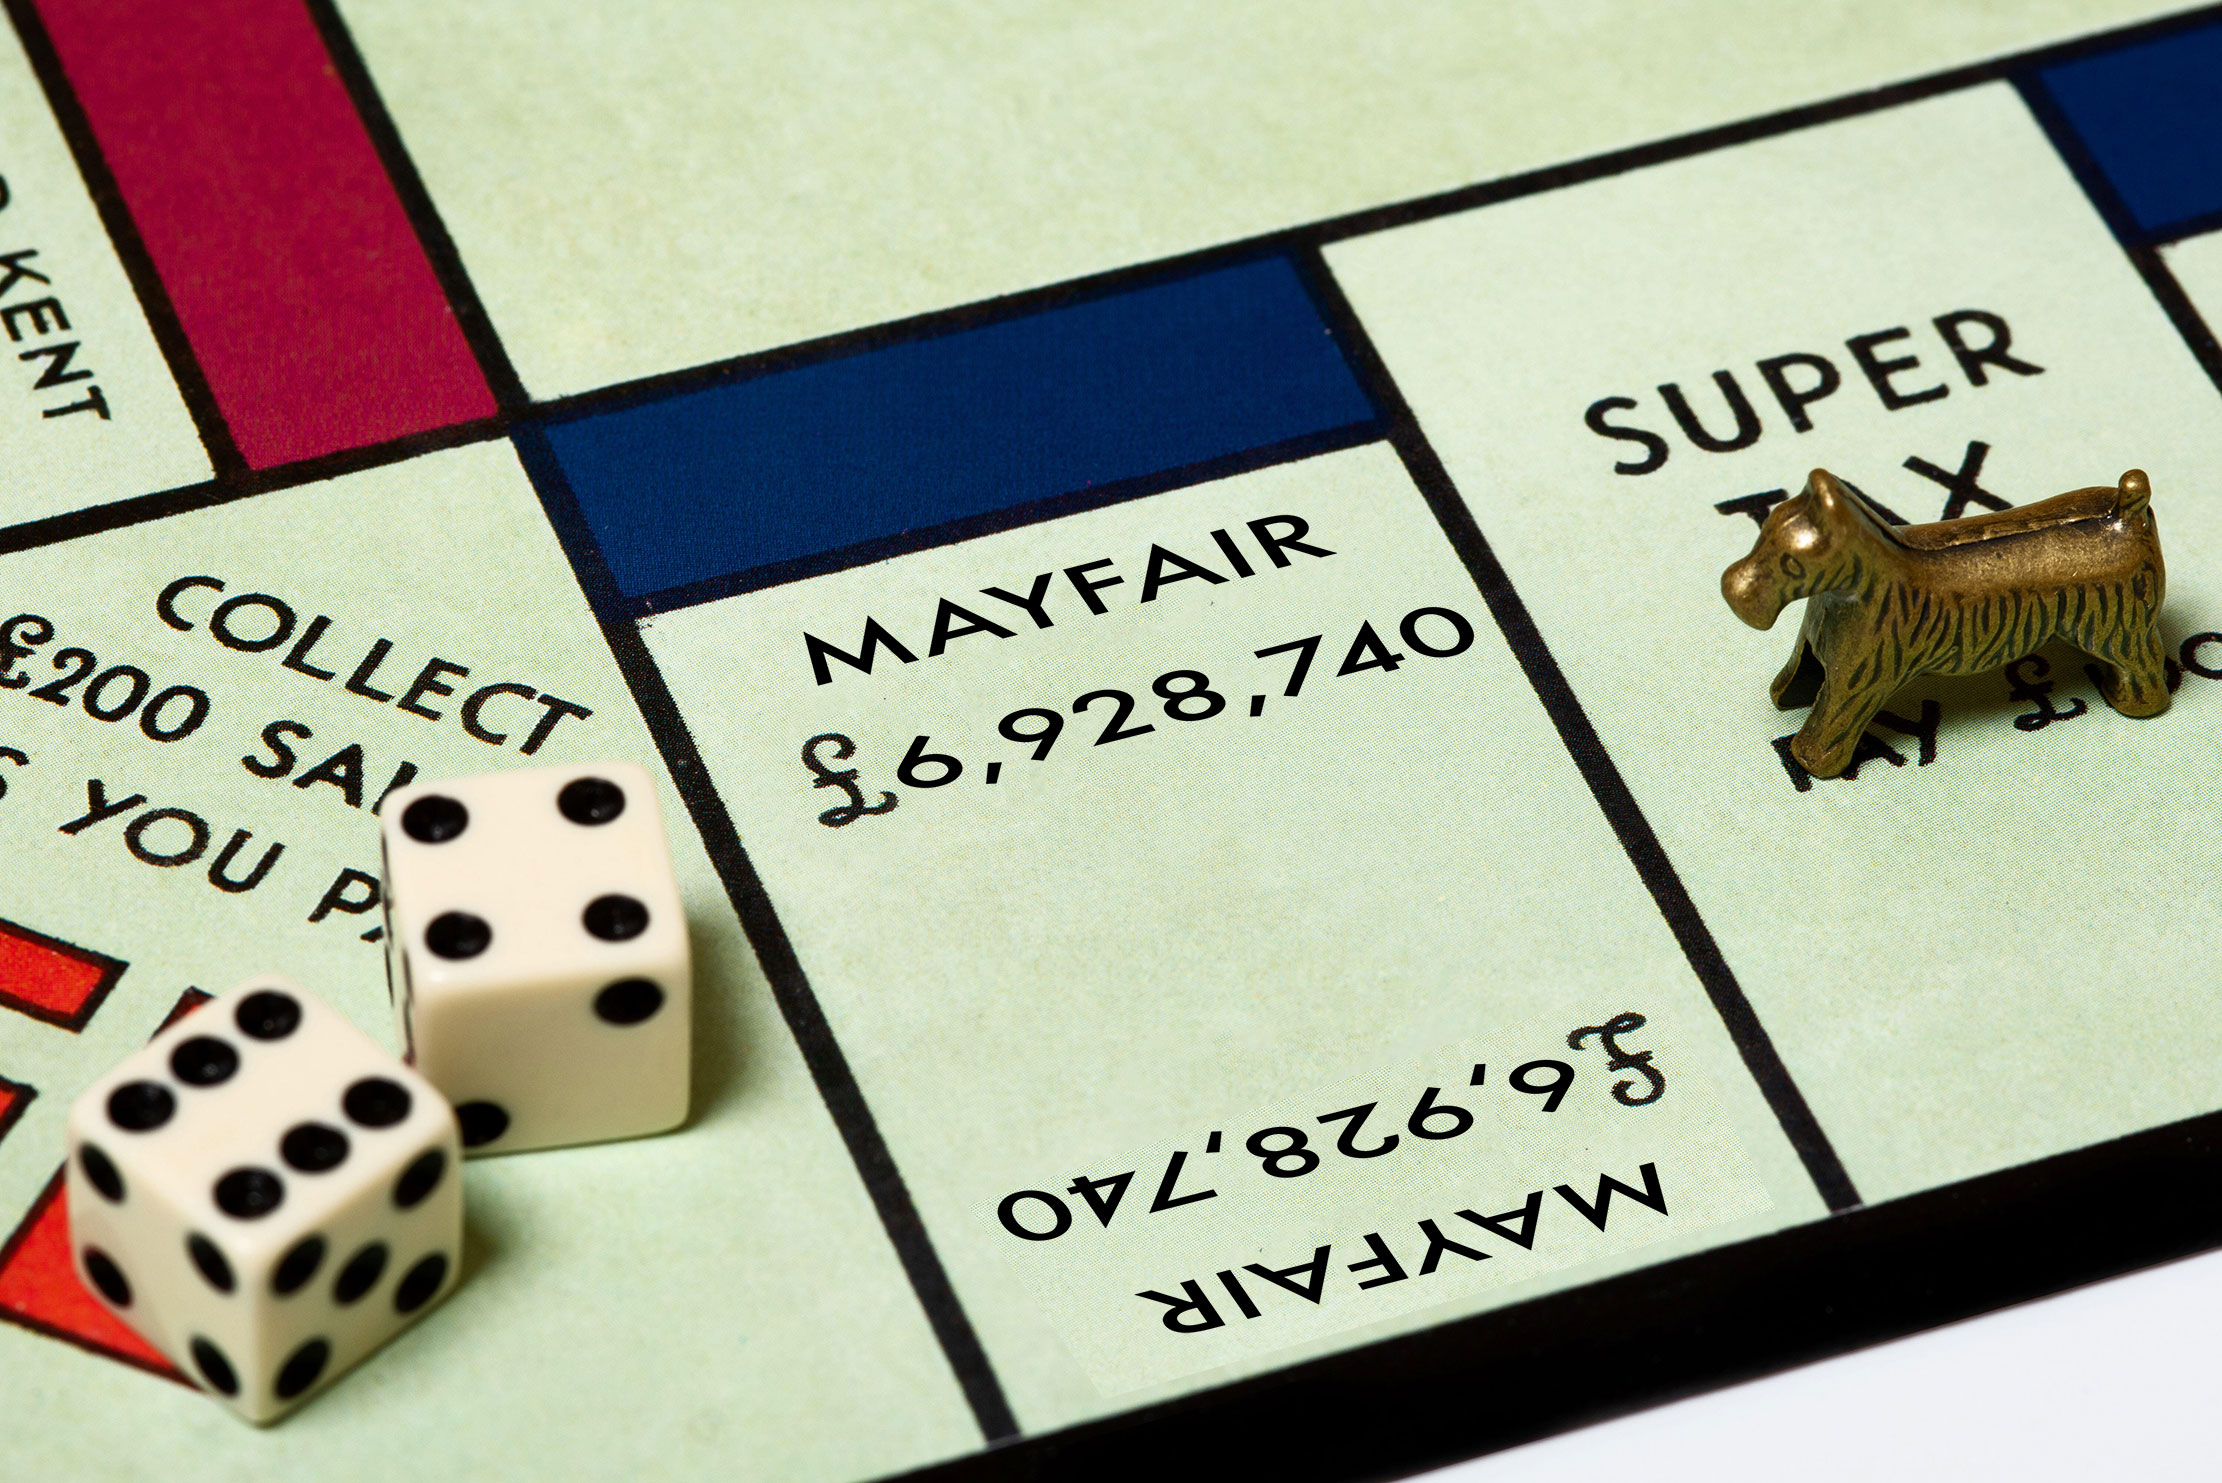
In 1936, the average house in London cost £350. Today, 88 years later, it’s over £500,000.
You’d know none of this by looking at a Monopoly board, however. Since its UK launch by Waddingtons 88 years ago, the perennially popular game
While there are almost endless versions of the game today (apparently more than 3,500 according to worldofmonopoly.com), the most-played version remains the original. And that 1936 board, barring a few minor updates in graphics and typography, is essentially the same as it was in its earliest British incarnation, both in the property prices and the order of the landmarks, from Old Kent Road to Mayfair.
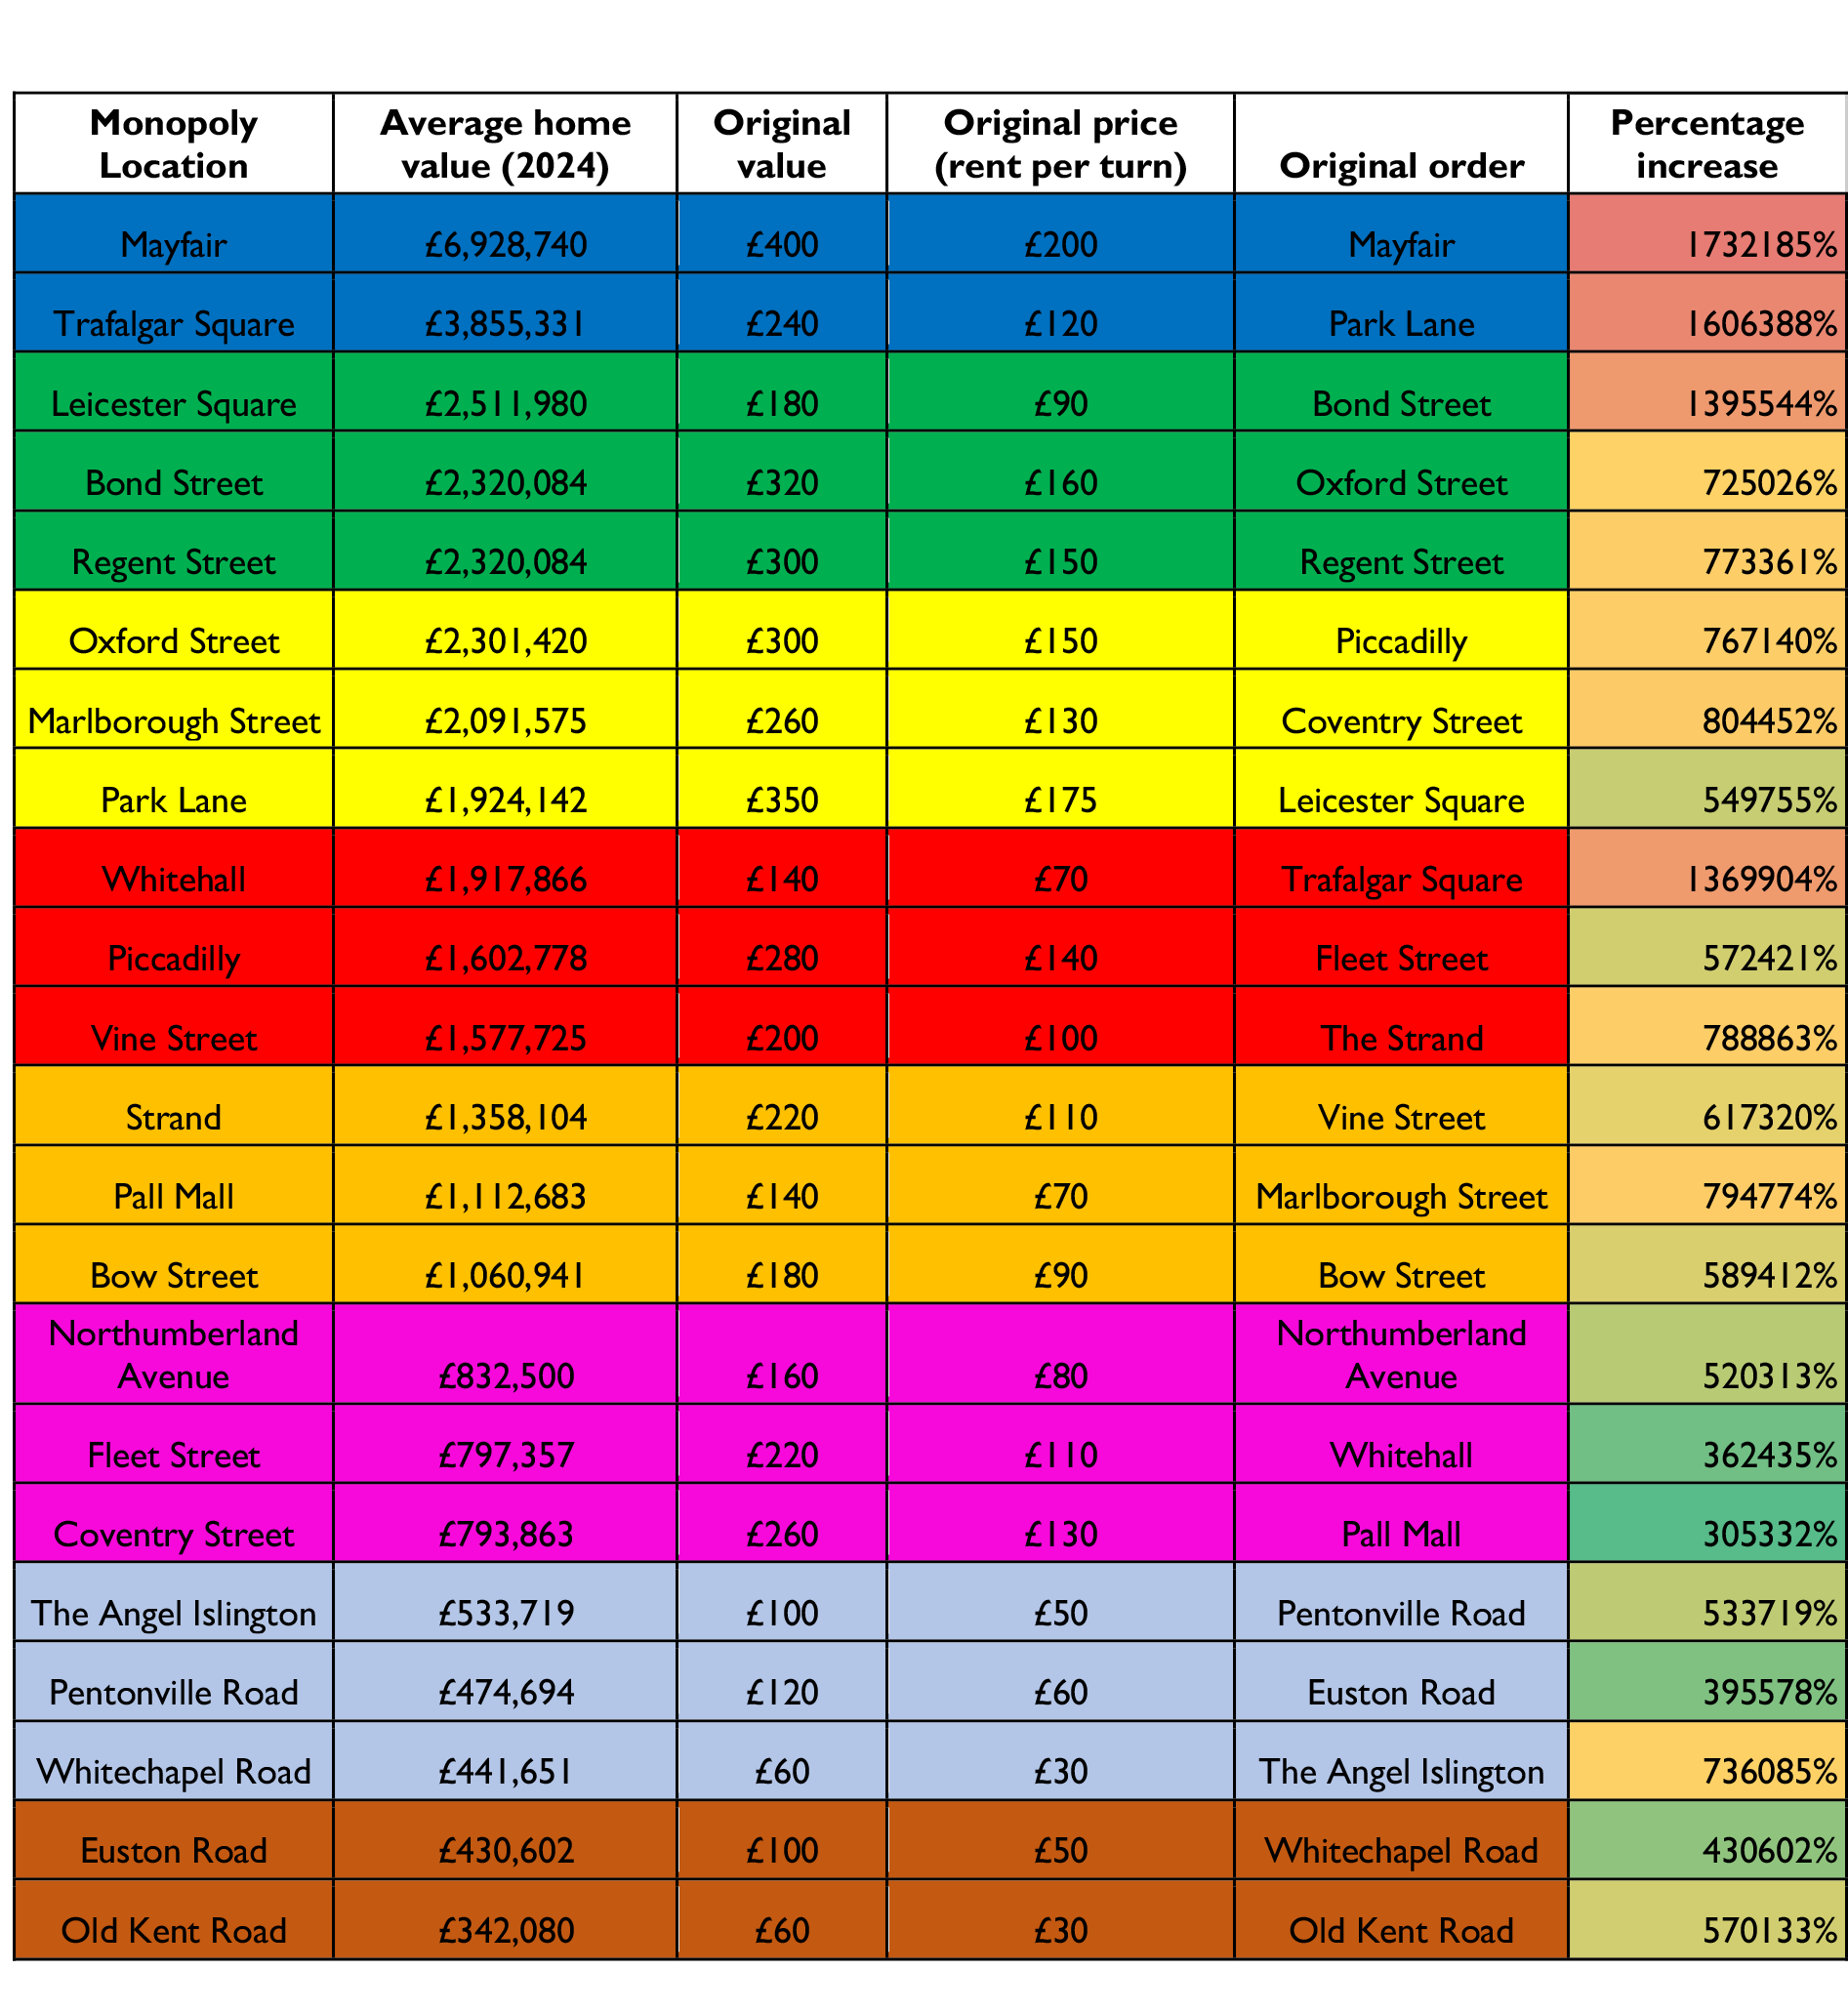
That begs an obvious question: what would the board look like today, though, if it reflected London’s property prices? A games company called 1337.Games dug through the latest property price statistics at Bricks & Logic to find out… and the answer is that not as much has changed as you might have imagined.
Mayfair retains the most expensive spot on the board, going from £400 in 1936 to over £6,000,000 in 2024 — an increase of over 1,730,000% — while Old Kent Road keeps its place in the ‘cheapest’ slot, with an average price today of £340,000, up 570,000% on the 1936 price of £60.

Several other roads have also kept their spots, Northumberland Avenue, Bow Street and Regent Street among them. Several have a minor reshuffle, with Bond Street up from £320 to around £2.3 million, still in the green group. Oxford Street fares less well, dropping into the yellow properties, replaced by Leicester Square.
The biggest move of the lot? Trafalgar Square, which moves from its slot in the red properties (original price: £240; new price £3.8 million) to take Park Lane’s space as the second most expensive property on the board. Park Lane clings to a space in the yellow group, but with a rise of ‘only’ 550,000% from £350 to £1.9 million, it’s been left behind. Coventry Street has an even more ignominious fate, with a price rise from £260 (safely in the yellow properties) to £793,000 leaving it far back along the board as the cheapest of the three roads in the pink group.
Exquisite houses, the beauty of Nature, and how to get the most from your life, straight to your inbox.
Clearly all this should be taken with the pinch of salt that it deserves, but it’s a bit of fun. And it does shed a bit of light on something else which has changed in the past 88 years: affordability. In 1936, the average wage of £150 a year meant that a house cost just a little over two years’ salary. Today, the average London house costs 11 times more than the average wage in the capital of £44,000.

Credit: Alamy Stock Photo
How to win at board games, from Monopoly and Cluedo to Scrabble and Snakes and Ladders
As millions of people around the country are set to have an enforced period at home, it'll be time to
Toby Keel is Country Life's Digital Director, and has been running the website and social media channels since 2016. A former sports journalist, he writes about property, cars, lifestyle, travel, nature.


