Best county explained
Alan Boyles reveals the workings behind the COUNTRY LIFE survey to find the best county in England


How did you decide which is the best county? Each county was assessed on quantifiable information that we gathered direct from a variety of authoritative sources, such as the CPRE, the Met Office, Defra and Natural England. Unfortunately, in many cases, data from the Isle of Wight wasn’t compatible with that from the rest of England, and, therefore, it wasn’t included.
How has the survey changed since our last one in 2003? There are new categories—such as Health, Flood Risk, Light Pollution, Local Food and Village Greens—and almost every aspect of the study has been refined or expanded. The Landscape category now includes broadleaved forest and green-belt acreage, as well as AONBs, SSSIs and national parks, and Heritage now counts Landmark Trust buildings and historic houses mentioned in Simon Jenkins’ England’s Thousand Best Houses, as well as National Trust properties. We decided that the survey had to reflect current concerns about the environment, so we looked at the rates of recycling and composting on a county-by-county basis in order to find the Greenest county.
* Read Country Life's article on why Devon was the best county in England 2009

* Read Country Life's article on why Devon was the best county in England 2009
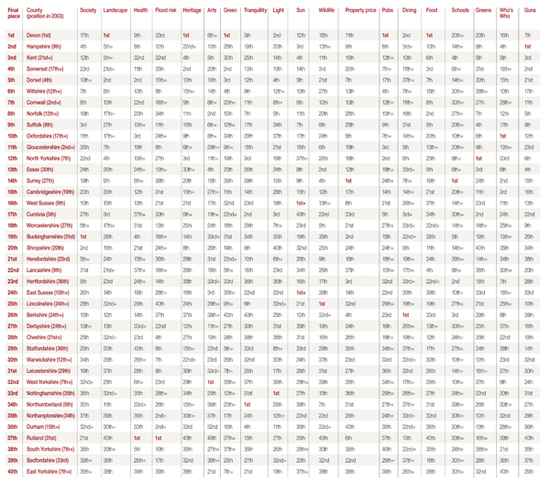
Table Key For each category, we ranked the 40 counties from the best (1st) to the worst (40th), and calculated which county had performed best overall. Each county’s position in the 2003 survey is shown in brackets, but please note that it is not a direct comparison with our 2003 survey.
Categories Society: the strength of each county’s social fabric, measured by local-council performance ratings, provided by the Audit Commission; recent crime statistics from the British Crime Survey; average levels of Council Tax; and the frequency, and cost, of fly-tipping, published by Defra
Landscape: the quality of the county’s landscape, measured by broad-leaved forest and green-belt acreage, as well as AONBs, SSSIs and national parks
Sign up for the Country Life Newsletter
Exquisite houses, the beauty of Nature, and how to get the most from your life, straight to your inbox.
Health: the health of the county and its inhabitants, measured by life expectancy, levels of exercise and hospital ratings
Flood risk: Percentage of properties in flood plains. The winner is the county least at risk
Heritage: the number of Landmark Trust buildings and historic houses mentioned in Simon Jenkins’ ‘England’s Thousand Best Houses’, as well as National Trust properties
Arts: the number of literary festivals and accredited museums
Green: the county’s Green credentials, measured by the rates of recycling and composting, as well as an assessment of each county’s ‘ecological footprint’, which is the space needed to support the average resident’s lifestyle
Tranquillity: according to CPRE data maps
Light pollution: according to CPRE data maps
Sunshine: average hours per year Wildlife: number of wildlife trusts and RSPB reserves
Property price: average residential price—the highest house prices being the best
Good pubs: number in ‘The Good Pub Guide 2008’
Dining: number of Michelin stars
Local food: number of entries in the BigBarn database
Top schools: number in ‘The Times’ list of the top schools
Greens: number of village greens
Who’s Who: number of entries in ‘Who’s Who’
Guns: number of shotgun licences
Country Life is unlike any other magazine: the only glossy weekly on the newsstand and the only magazine that has been guest-edited by HRH The King not once, but twice. It is a celebration of modern rural life and all its diverse joys and pleasures — that was first published in Queen Victoria's Diamond Jubilee year. Our eclectic mixture of witty and informative content — from the most up-to-date property news and commentary and a coveted glimpse inside some of the UK's best houses and gardens, to gardening, the arts and interior design, written by experts in their field — still cannot be found in print or online, anywhere else.
-
 A woolly mammoth skeleton is among the curiosities for sale to save fire-ravaged Parnham Park
The auction of the owner James Perkins' collection, hosted by Dreweatts, tomorrow (May 13), will be used to fund renovation works at Parnham Park in Dorset.
-
 The ‘utterly unique’ skincare brand that’s used in the ‘world’s best hotel’ spa
The Seed to Skin brand was the byproduct of one woman’s length fertility journey — it’s so good that today it’s used in a hotel voted the ‘world’s best’.